| Database Window Screenshots |
| Here are some screen shots of Plato's database window. This is the main window where most of your work with Plato will take place. There are a number of helper windows that are used for various specialized tasks, and these are described under their own headings. |
| |
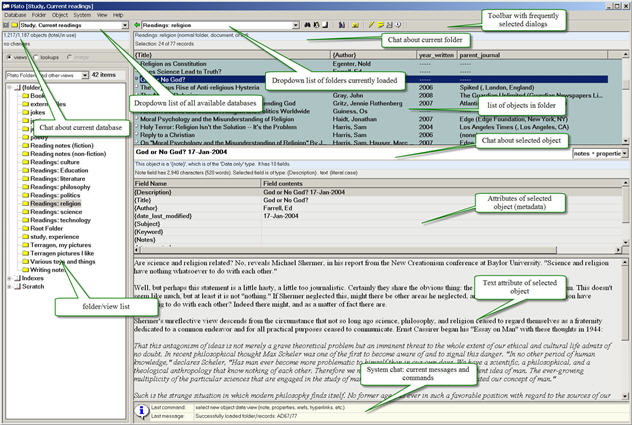
| Database Window |
|
| shown in the 'everything open' view, with screen elements labeled. All of the elements shown here (except the menu and toolbar) can be turned on or off individually to suit preferences.
|
| |
| Database Window, Graphic Display |
|
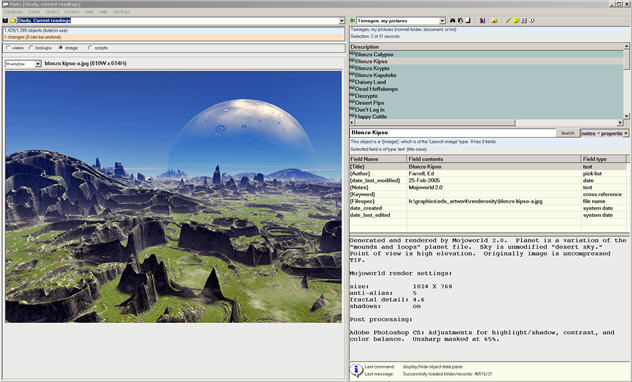
| shows the graphic display to the left. Graphics can be displayed at their original size, to fit the screen (shown here), or at various zoom levels. |
| |
| Database Window, No-folders Display |
|
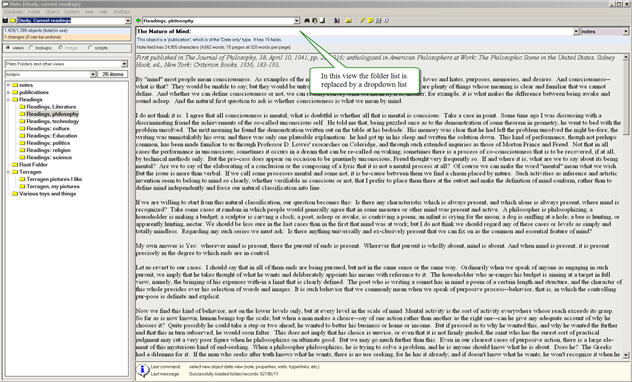
| shows the notes display with folders turned off. Note the folder list is replaced with a much smaller drop down list that contains the folder list content. |
| |
| Database Window, Expanded Script List |
|
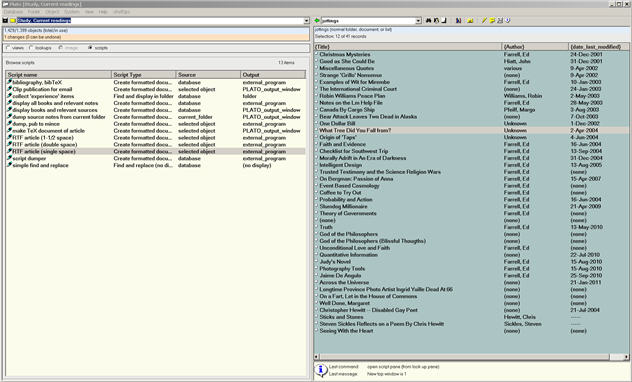
| shows the scripts list with most of its columns displayed. The list can be sorted by column. |
| |
| Database Window, Bookmark List |
|
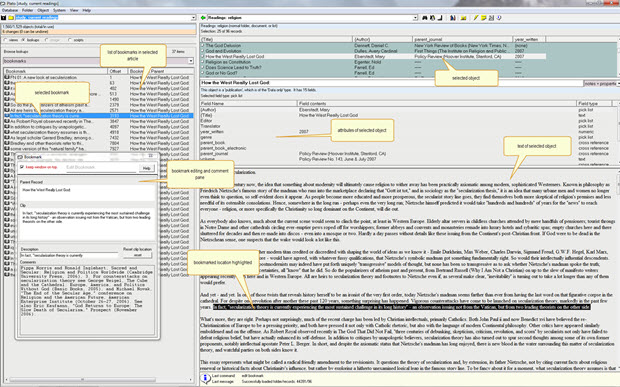
| shows the bookmark list with most of its columns displayed. The list can be sorted by column. |
| |
| Database Window (File List) |
|
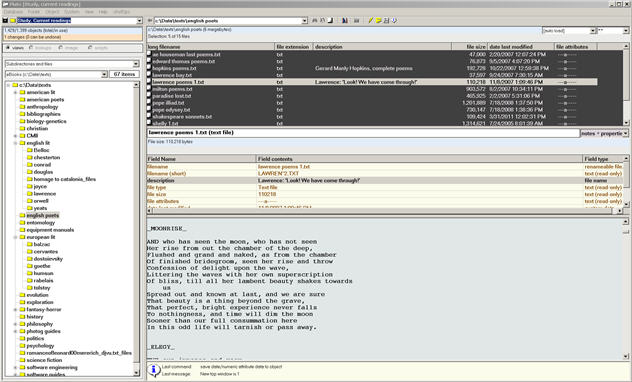
| shows Plato being used in its file management mode. In place of the folder/view list (left) is a selected subdirectory list; in place of folder objects (right top) is a list of files in the selected subdirectory; in place of the object data (right bottom) is file data: filename, description, size, and the various action dates. The contents of the file may also be displayed; text and RTF files may be directly edited here, binary files may be displayed in hex mode. Image files may be displayed in Plato's image pane. |
| |
| Database Helper Screens |
| Database helper screens assist you in digging more deeply in to the guts of Plato. The screens help you to: search the database, manage and display cross references, manage categories, build and manage concordances, display database properties and settings, and set up and display milti-dimensional clusters. |
| |
| Search Window (Concordance) |
|
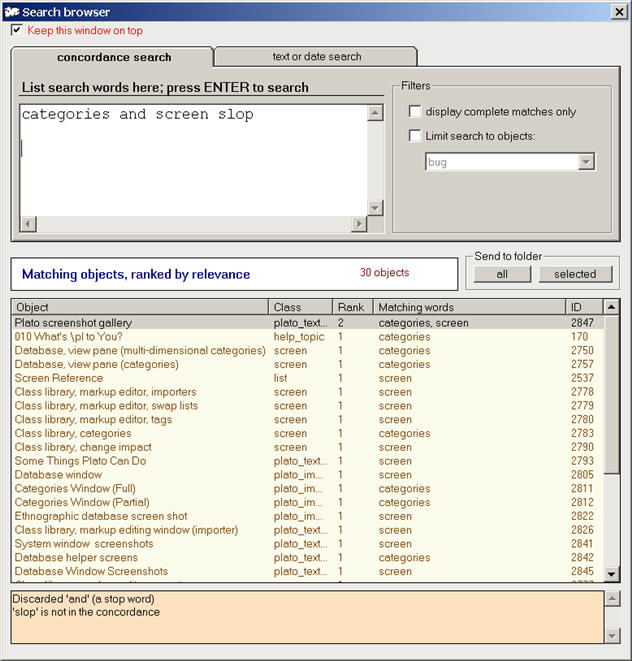
| allows you to do quick searches using the concordance. Search terms are typed into the text box at the top left of the search window and the matching objects are shown in the list below it, listed in order of best matches. Concordance searches are nearly instantaneous, though they deliver results based solely on word matches (phrases are treated as a list of words, for instance). |
| |
| Search Window (Text) |
|
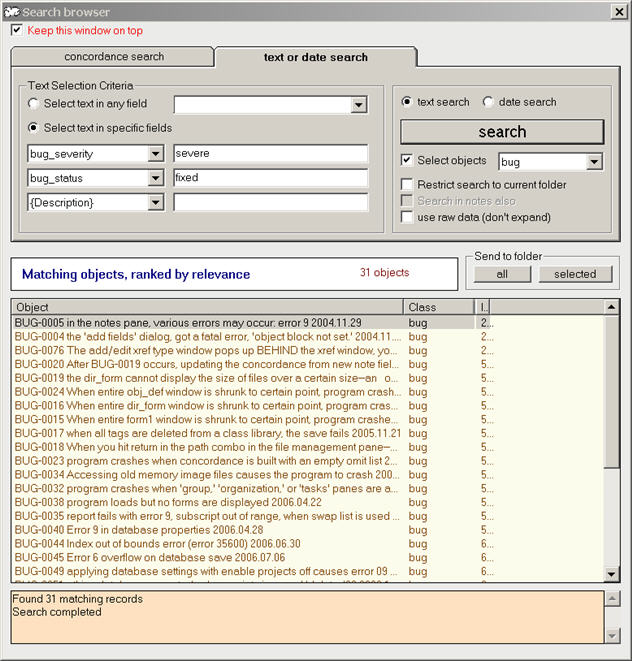
| shows the various parameters that may be used for a full-text search. Full text searches can be made on words or phrases wherever they occur in a object (metadata, notes or both), or you can select up to three specific attributes and search for content within them. Full text searches are not assisted by the concondance, so they are slower than concordance searches. |
| |
| Search Window (Dates) |
|
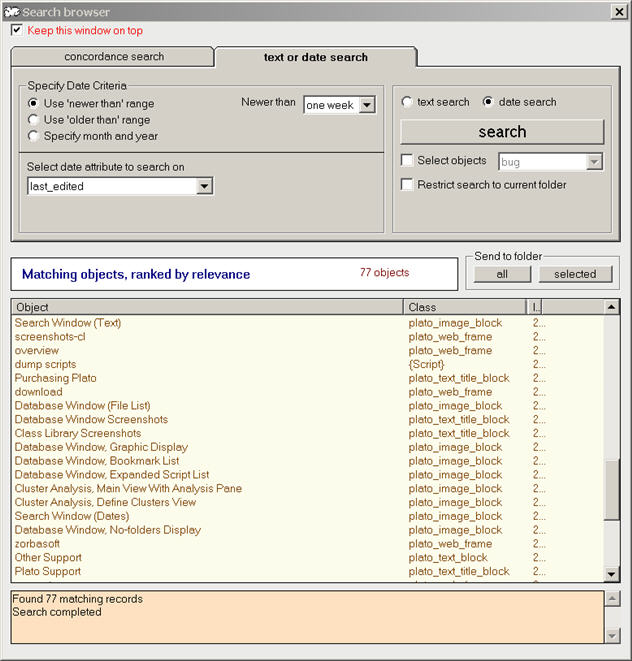
| show the parameters for date searches. Date searches may be conducted via proximity to the current date (i.e., within 7, 14, 30, 60, etc. days of the curent date). You may also select a specific month/year to look within. You may also specify the date attribute to search against (date last edited, date created, etc.). |
| |
| Categories Window (Full) |
|
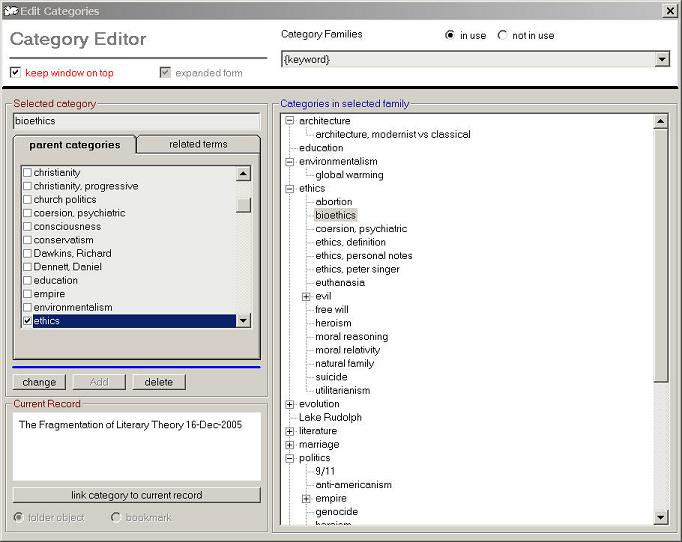
| shows the category editing window in its stand-alone form. Category families may be edited in this window, including adding and deleting categories, changing category names, and creating and changing category hierarchies. |
| |
| Categories Window (Partial) |
|
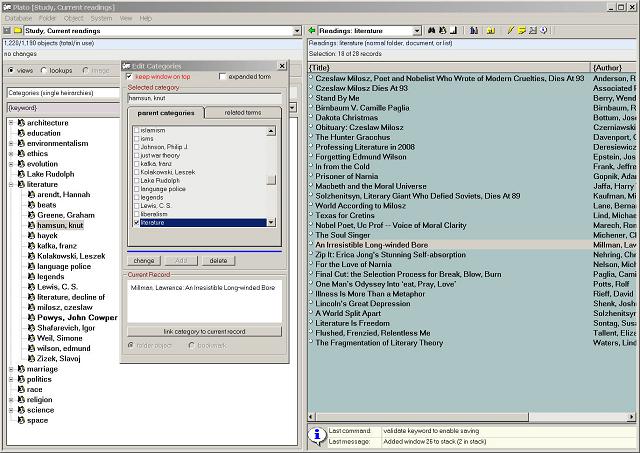
| is shown against the context of the main database screen. The small category view is used in conjuction with the category display in the database window (seen at left under the category window). The category list changes as you scroll through the database categories. |
| |
| Cluster Analysis, Main View With Analysis Pane |
|
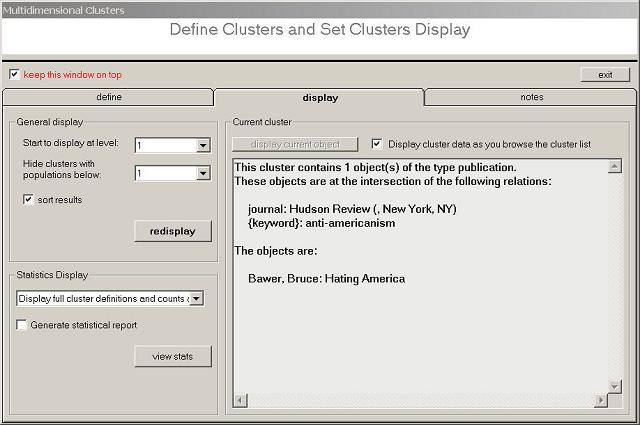
| shows the multi-dimensional cluster display (the left part of the main database screen) with the cluster analysis panel over the right side of the database screen. The cluster analysis pane is interactive: the view changes as you scroll through the underlying cluster display. You can use the pane to interactively filter the cluster display as well. If you want to examine a cluster more thoroughly, double click on it and all of the objects in will be sent to a scratch folder where you may examine and edit them. |
| |
| Cluster Analysis, Define Clusters View |
|
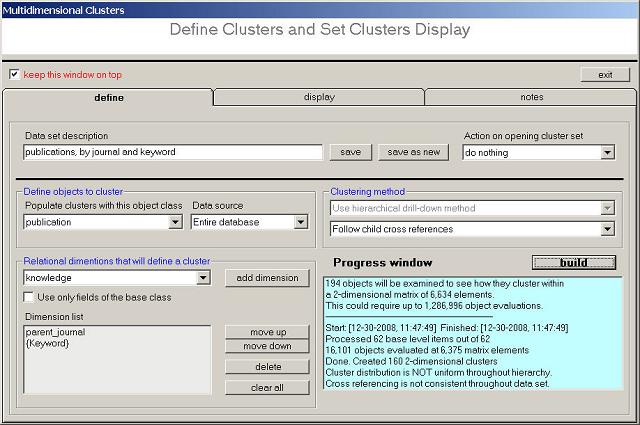
| shows the form with which to define the clusters you want to look at, and build the data structure to display them. |
| |
| Database Properties Window |
|
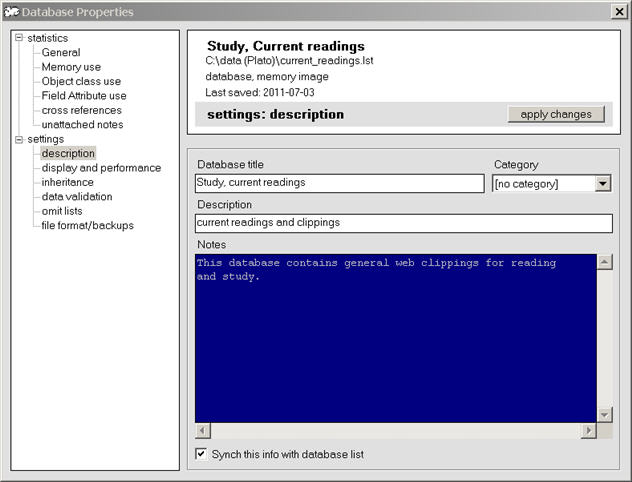
| shows a variety of database properties and settings. Properties include general statistics on database elements, database memory use by category, object class and attribute use in a database, and cross references. Settings include numerous display and performance settings, and settings that control the behavior of sorting, title capitaization, and other things. |
| |
|
|

